This is a short tutorial on how to setup and start debugging go in Helix. Assuming knowledge of how to use Helix’s basic editing and go.
Helix has built in support for DAP (Debug Adapter Protocol). It can do things like step through a program, setup breakpoints, and inspect local varaibles. Currently not as capable as the debugging tools avaialble in Intellij or Visual Studio, but can be useful if you want basic debugging abilities without the need for a full GUI based IDE.
Requirements
Helix by default uses gopls as go’s language server and delve as go’s debugger. These are good choices for go’s current tools as the support the stands for LSP and DAP.
Ensure Helix’s golang support
To ensure if the tools were installed on your path run the following command:
hx --health go
This should give the output
Configured language server: gopls
Binary for language server: /[GOPATH]/bin/gopls
Configured debug adapter: dlv
Binary for debug adapter: /[GOPATH]/bin/dlv
Highlight queries: ✓
Textobject queries: ✓
Indent queries: ✓
This tells us that gopls and dlv are both installed on our path. Helix, like most terminal editors, uses the tools we have installed on path instead of an integrated enviroment such as Intellij.
Simple Code Example
Lets create a directory with some code to debug.
mkdir go-debug
cd go-debug
go mod init example/hello
touch hello.go
// hello.go
package main

import (
	"fmt"
	"math/rand"
)

func main() {
	random := add_two_random_numbers()
	fmt.Println("Added two random numbers: ", random)
}

func add_two_random_numbers() int {
	n1 := rand.Intn(100)
	n2 := rand.Intn(100)

	return n1 + n2
}
Helix Debugger
The Helix debugger accessible through a few commands: :dbg, :dgb-remote, :dbg-eval.
Or we can select a debug target with <space>-g. This brings up the debugging menu.
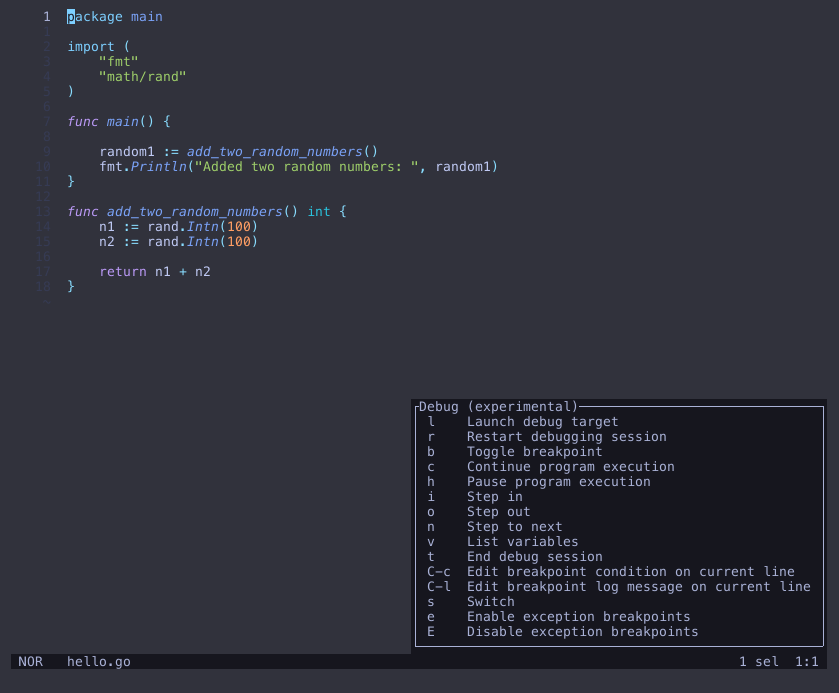
To add a breakpoint from the debug menu, press b to toggle a breakpoint for the current line,
or if you are familar with other debugging tools you can also click the line number.
Lets add a breakpoint to the return statement in our add_two_numbers function.
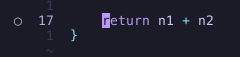 A little dot appears next to the line number indicating a breakpoint is set.
Now we can run our code to the breakpoint and inspect the local variables.
From the debug menu press l, then select source and enter the current source folder or main file, in this case, hello.go.
Our debugger will pause the thread due to the breakpoint we set, from here we can press v to view all local variables.
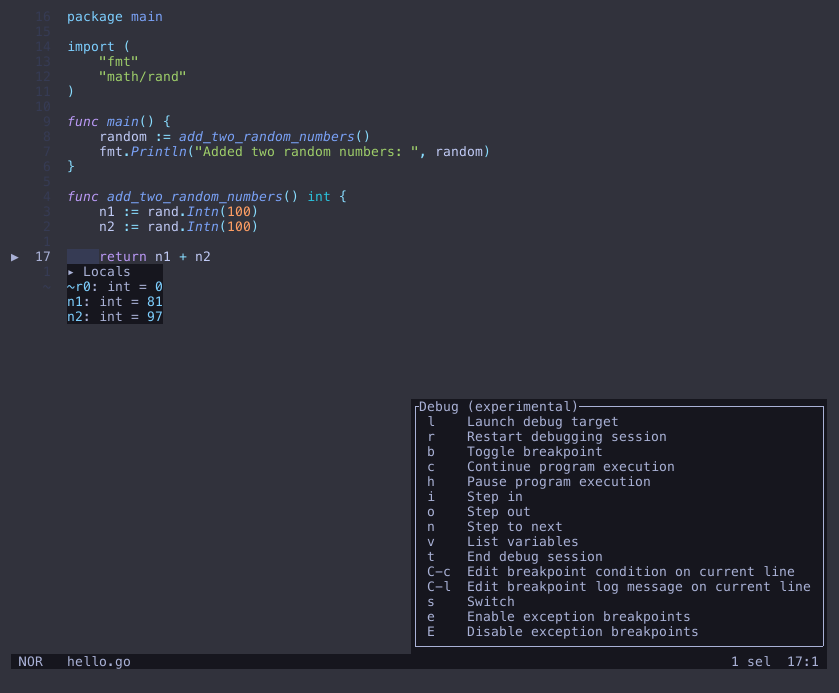
From here we can continue the thread with c or stop/terminate the session with t.
Now we can debug basic programs that are run within our editor, next we will look at debugging an
actively running application that updates when code is changed.
Debugging a server
Lets modify the code to be a continously running server that accepts requests.
// hello.go
package main

import (
	"fmt"
	"math/rand"
	"net/http"
	"os"
)

func add_two_random_numbers() int {
	n1 := rand.Intn(100)
	n2 := rand.Intn(100)
	return n1 + n2
}

func headers(w http.ResponseWriter, req *http.Request) {
	num := add_two_random_numbers()
	fmt.Println(num)

	for name, headers := range req.Header {
		for _, h := range headers {
			fmt.Fprintf(w, "%v: %v\n", name, h)
		}
	}
}

func main() {
	http.HandleFunc("/", headers)
	port := ":8090"

	// We will need this later
	fmt.Println("PID: ", os.Getpid())
	http.ListenAndServe(port, nil)
}
We need to build our application turning off golang optimizations.
go build -gcflags="all=-N -l" -o hello
./hello # PID: 1001
Using the steps above, set a breakpoint. Then instead of selecting source, select attach, then enter your pid (1001 in this example).
Send a request to our server, this can be done be accessing localhost:8090 in our browser or from the following curl command:
curl localhost:8090
The request shouldn’t have completed, instead if we look at the editor we can see the program has been paused at the breakpoint, from here we can inspect all local varaibles, or continue the program and then we see the request complete.